
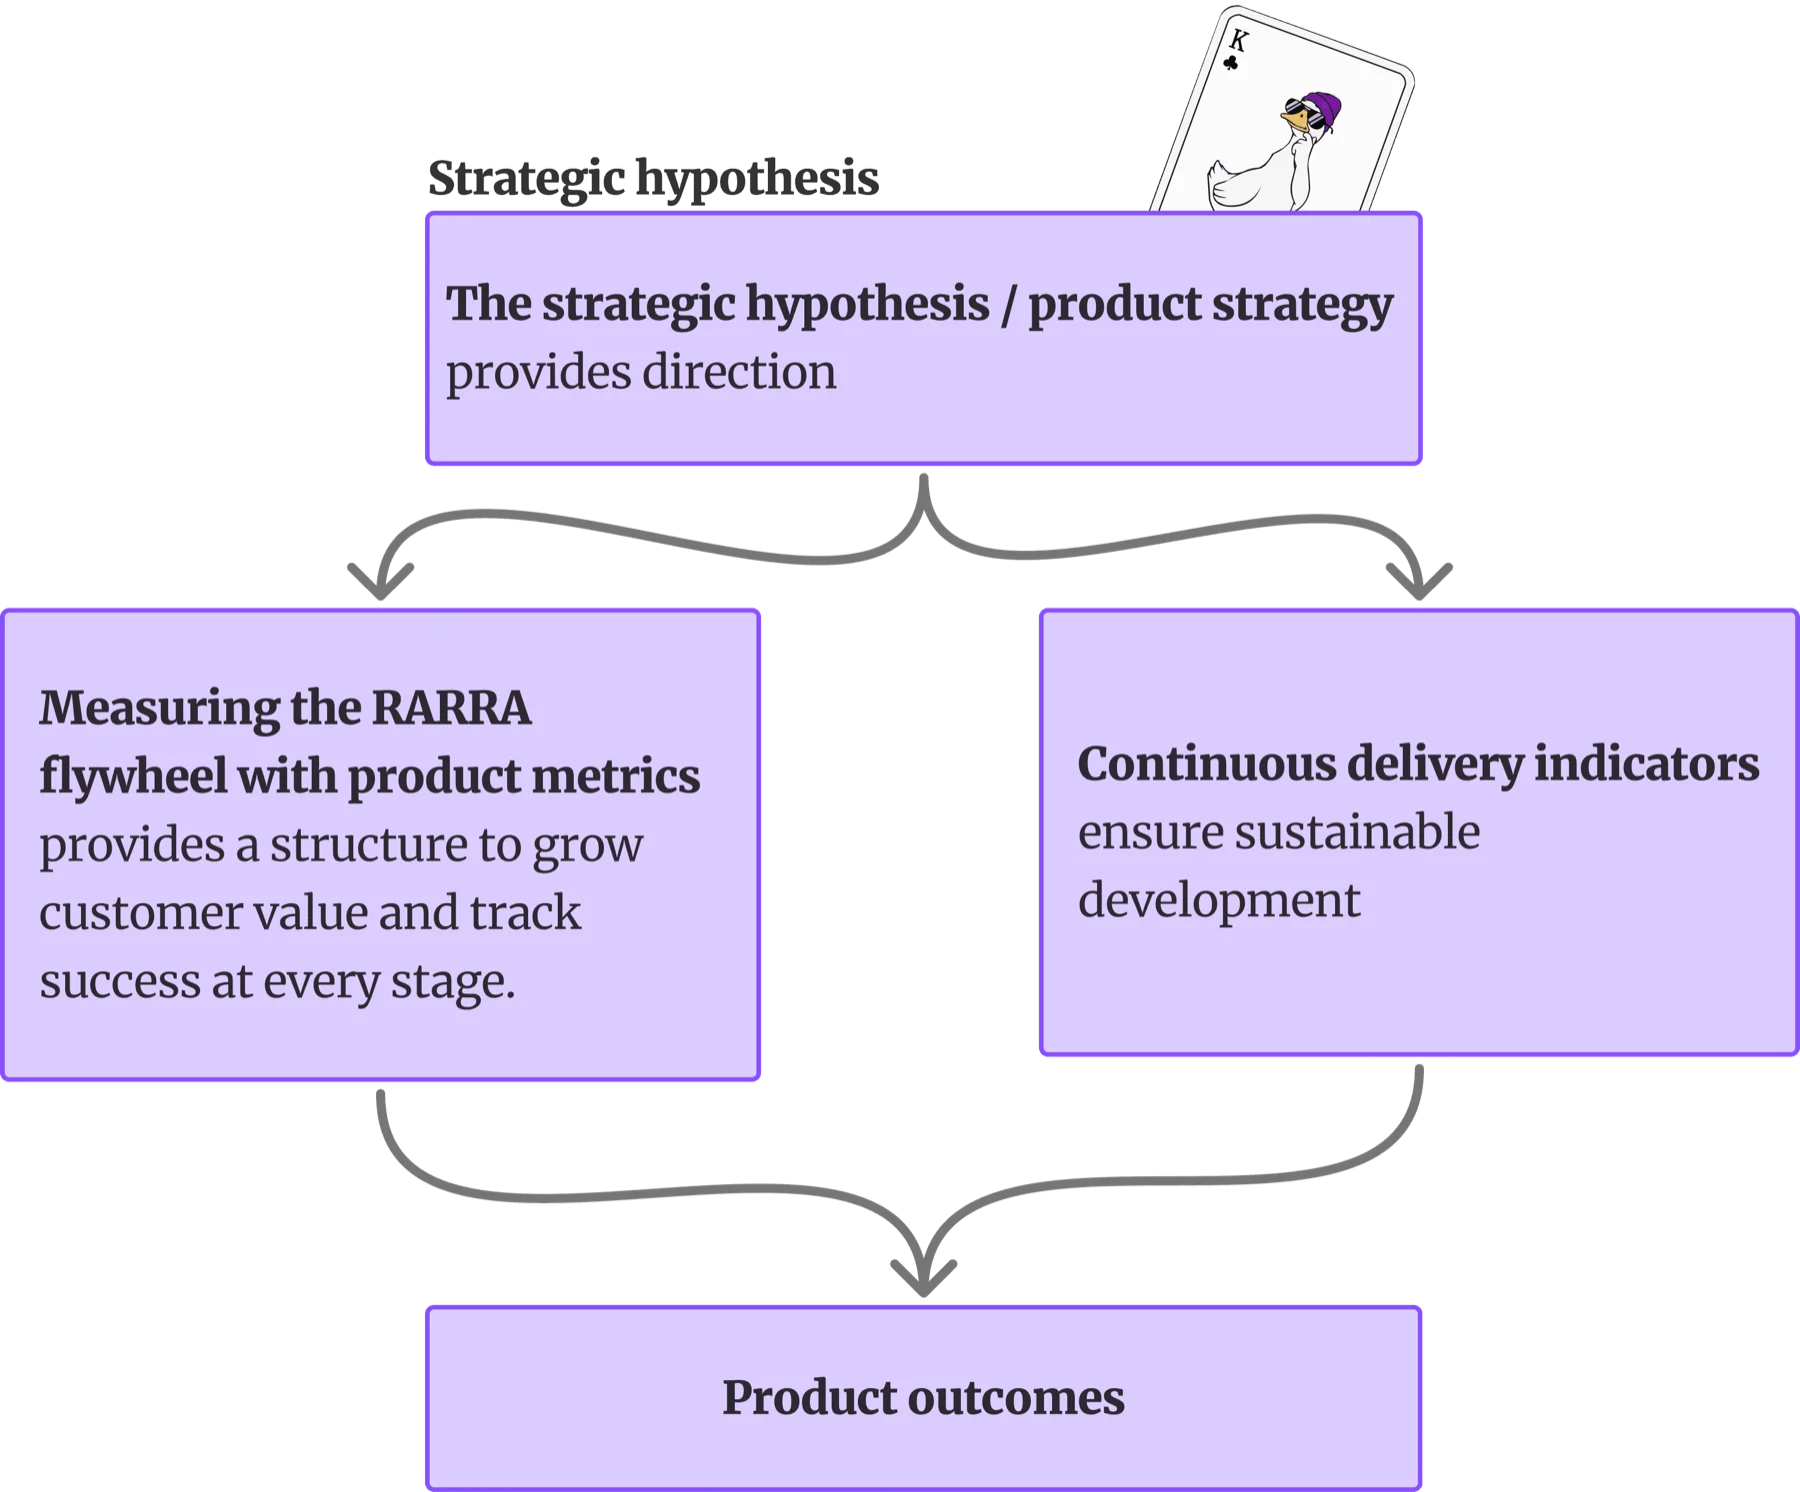
This guide helps teams systematically define product outcomes that support the business and are grounded in customer problems. The process moves from a strategic hypothesis, through the RARRA phases, to observations, prioritization, and outcome definition.
If you don’t yet have a product strategy or strategic hypothesis, we recommend running a goal-setting workshop. If you haven’t established product metrics yet, we recommend setting them up here.
Tips for a good product outcome
Outcomes can be business centric, for example to “increase the customer lifetime value”, or they might be product centric, for example to “increase feature x usage”. Ultimately product outcomes should link to business outcomes and teams should not try to directly pursue business outcomes.
New features might improve business metrics, but not directly. A better onboarding flow might directly decrease the time used onboarding or increase the user activation rate (product outcomes) and in addition, indirectly decrease customer acquisition cost (business outcome).
What to aim for:
- Specific and clear: Focus on a single problem or bottleneck. Avoid vague statements like “improve user experience.”
- Measurable: Define concrete metrics to track success, think both leading and lagging indicators.
- Actionable and achievable: The outcome should be within the team’s control and realistically achievable.
- Customer-centered: Always tie the outcome to customer value, not internal activity.
- Time-bound: Set a clear timeframe for achieving the outcome.
- Impactful: Prioritize outcomes that significantly affect business goals and the strategic hypothesis.
- Testable and learnable: The outcome should enable learning, either by succeeding or by revealing why it did not.
What to avoid:
- Vague or aspirational statements such as “make customers happier” without metrics.
- Outcomes that focus on outputs instead of customer impact, like “release X.”
- Overly broad goals that cannot be measured or tracked.
- Outcomes outside the team’s control or that rely entirely on external factors.
A good product outcome directly solves a key customer problem, advances the strategic hypothesis, and can be measured to show real progress and learning.
Step 1: Identify the main bottlenecks and problems
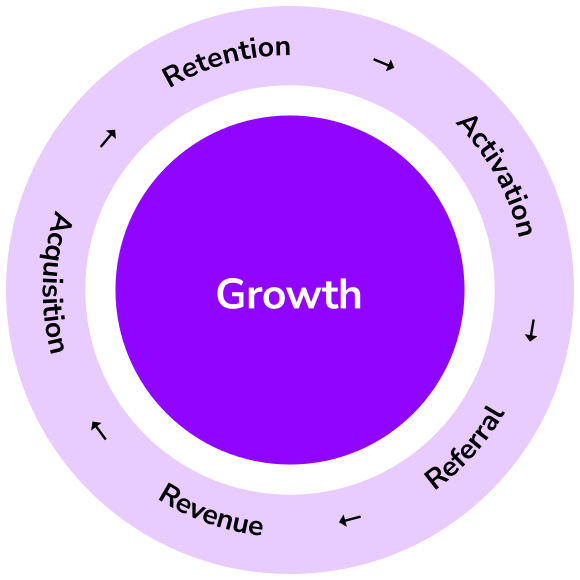
The goal is to make the RARRA flywheel spin as smoothly as possible, without friction or obstacles. To do this, we first identify the biggest “rocks” blocking the wheel in the RARRA process. But it’s not just about the largest obstacles: small rocks matter too. By continuously removing both big and small impediments, the flywheel gains momentum through steady, incremental improvements. Prioritizing Retention first ensures that every gain in Activation, Referral, or Revenue adds energy to the wheel. Over time, these small wins compound, creating a self-reinforcing cycle of growth and ongoing product and business success.
Identify the bottlenecks in the RARRA phases
- Check product KPIs: funnel analysis, churn, feature usage, conversions, etc.
- Review RARRA questions: identify where customers face the most challenges.
- Pinpoint the biggest obstacle: determine which phase most blocks progress and affects the strategic hypothesis.
💡 All questions should be considered through the lens of the strategic hypothesis: every investigation should link back to how actions support the business objective.
Objective: Examine the entire RARRA funnel and document observations and obstacles. Pinpoint the biggest obstacle: determine which phase most blocks progress and affects the strategic hypothesis.
Retention
- What is the churn rate? Is it at a healthy level?
- What prevents customers from staying and using the product regularly?
- Which factors cause churn or reduce long-term engagement?
- Which features, processes, or experiences create value that customers want to retain?
Activation
- How do we ensure new customers quickly experience the product’s value?
- What is the critical goal of the first-use experience?
- Which processes or features prevent users from reaching the “aha” moment?
- What is needed for users to understand the product’s value as quickly as possible?
Referral
- How likely are satisfied customers to recommend the product or service?
- Which factors encourage or prevent referrals?
- Which experiences or features do customers value enough to share with others?
- At what point could referral naturally occur?
Revenue
- How is revenue currently generated in this segment?
- Which factors affect contract value and duration?
- Where in the process or product could value be increased to grow revenue?
- Which actions directly support revenue growth?
Acquisition
- How are new customers currently reached, and how effective are the efforts?
- Which channels and actions generate high-quality leads?
- Which factors prevent leads from converting into paying customers?
Example main bottlenecks and problems
| Stage | Observations |
|---|---|
| Retention | Only 25% of users use the core feature more than twice per week. Daily active users drop by 40% after the first month. |
| Activation | 50% of new users don’t complete onboarding. 35% of signups abandon account setup. Only 40% of users reach the first key milestone within 24 hours. |
| Referral | Referral conversion rate is 2%. 20% of reviews are left in app stores instead of referring friends. |
| Revenue | Upsell adoption rate is 10%. |
| Acquisition | 20% of leads fail to meet target segment criteria. 30% of users abandon the signup form. |
Step 2: Prioritize
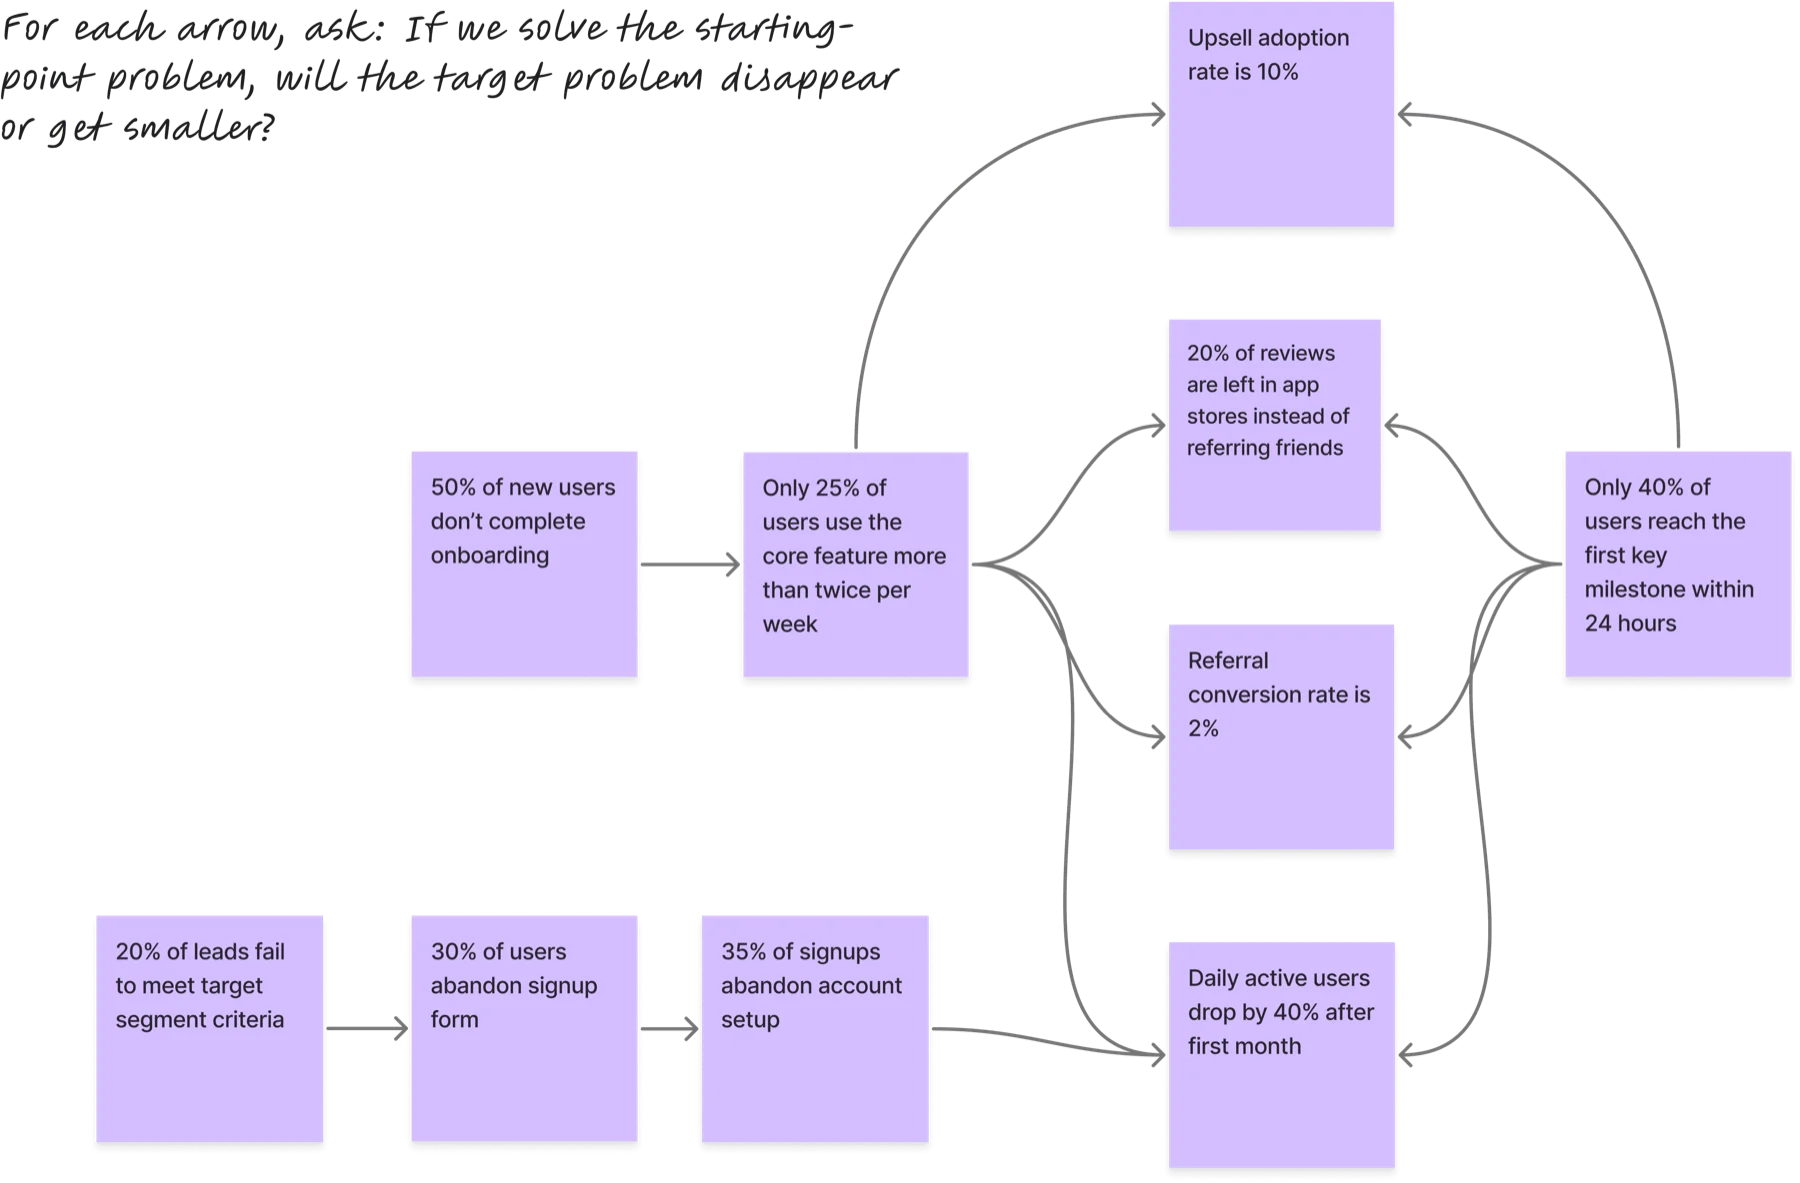
Use Dependency Mapping to visualize the causal relationships between the obstacles that might be holding your team back from achieving its goals. Start by charting the bottlenecks you have identified, then draw arrows from a cause (an issue that directly contributes to another) to its effect (the resulting consequence). By completing this map, you will be able to pinpoint the root constraints, the high-leverage problems with the most arrows leading away from them. Focusing on these upstream bottlenecks is key because solving them is likely to create a domino effect, unlocking multiple downstream solutions at once. This provides the most efficient path to test and validate your strategic hypothesis.
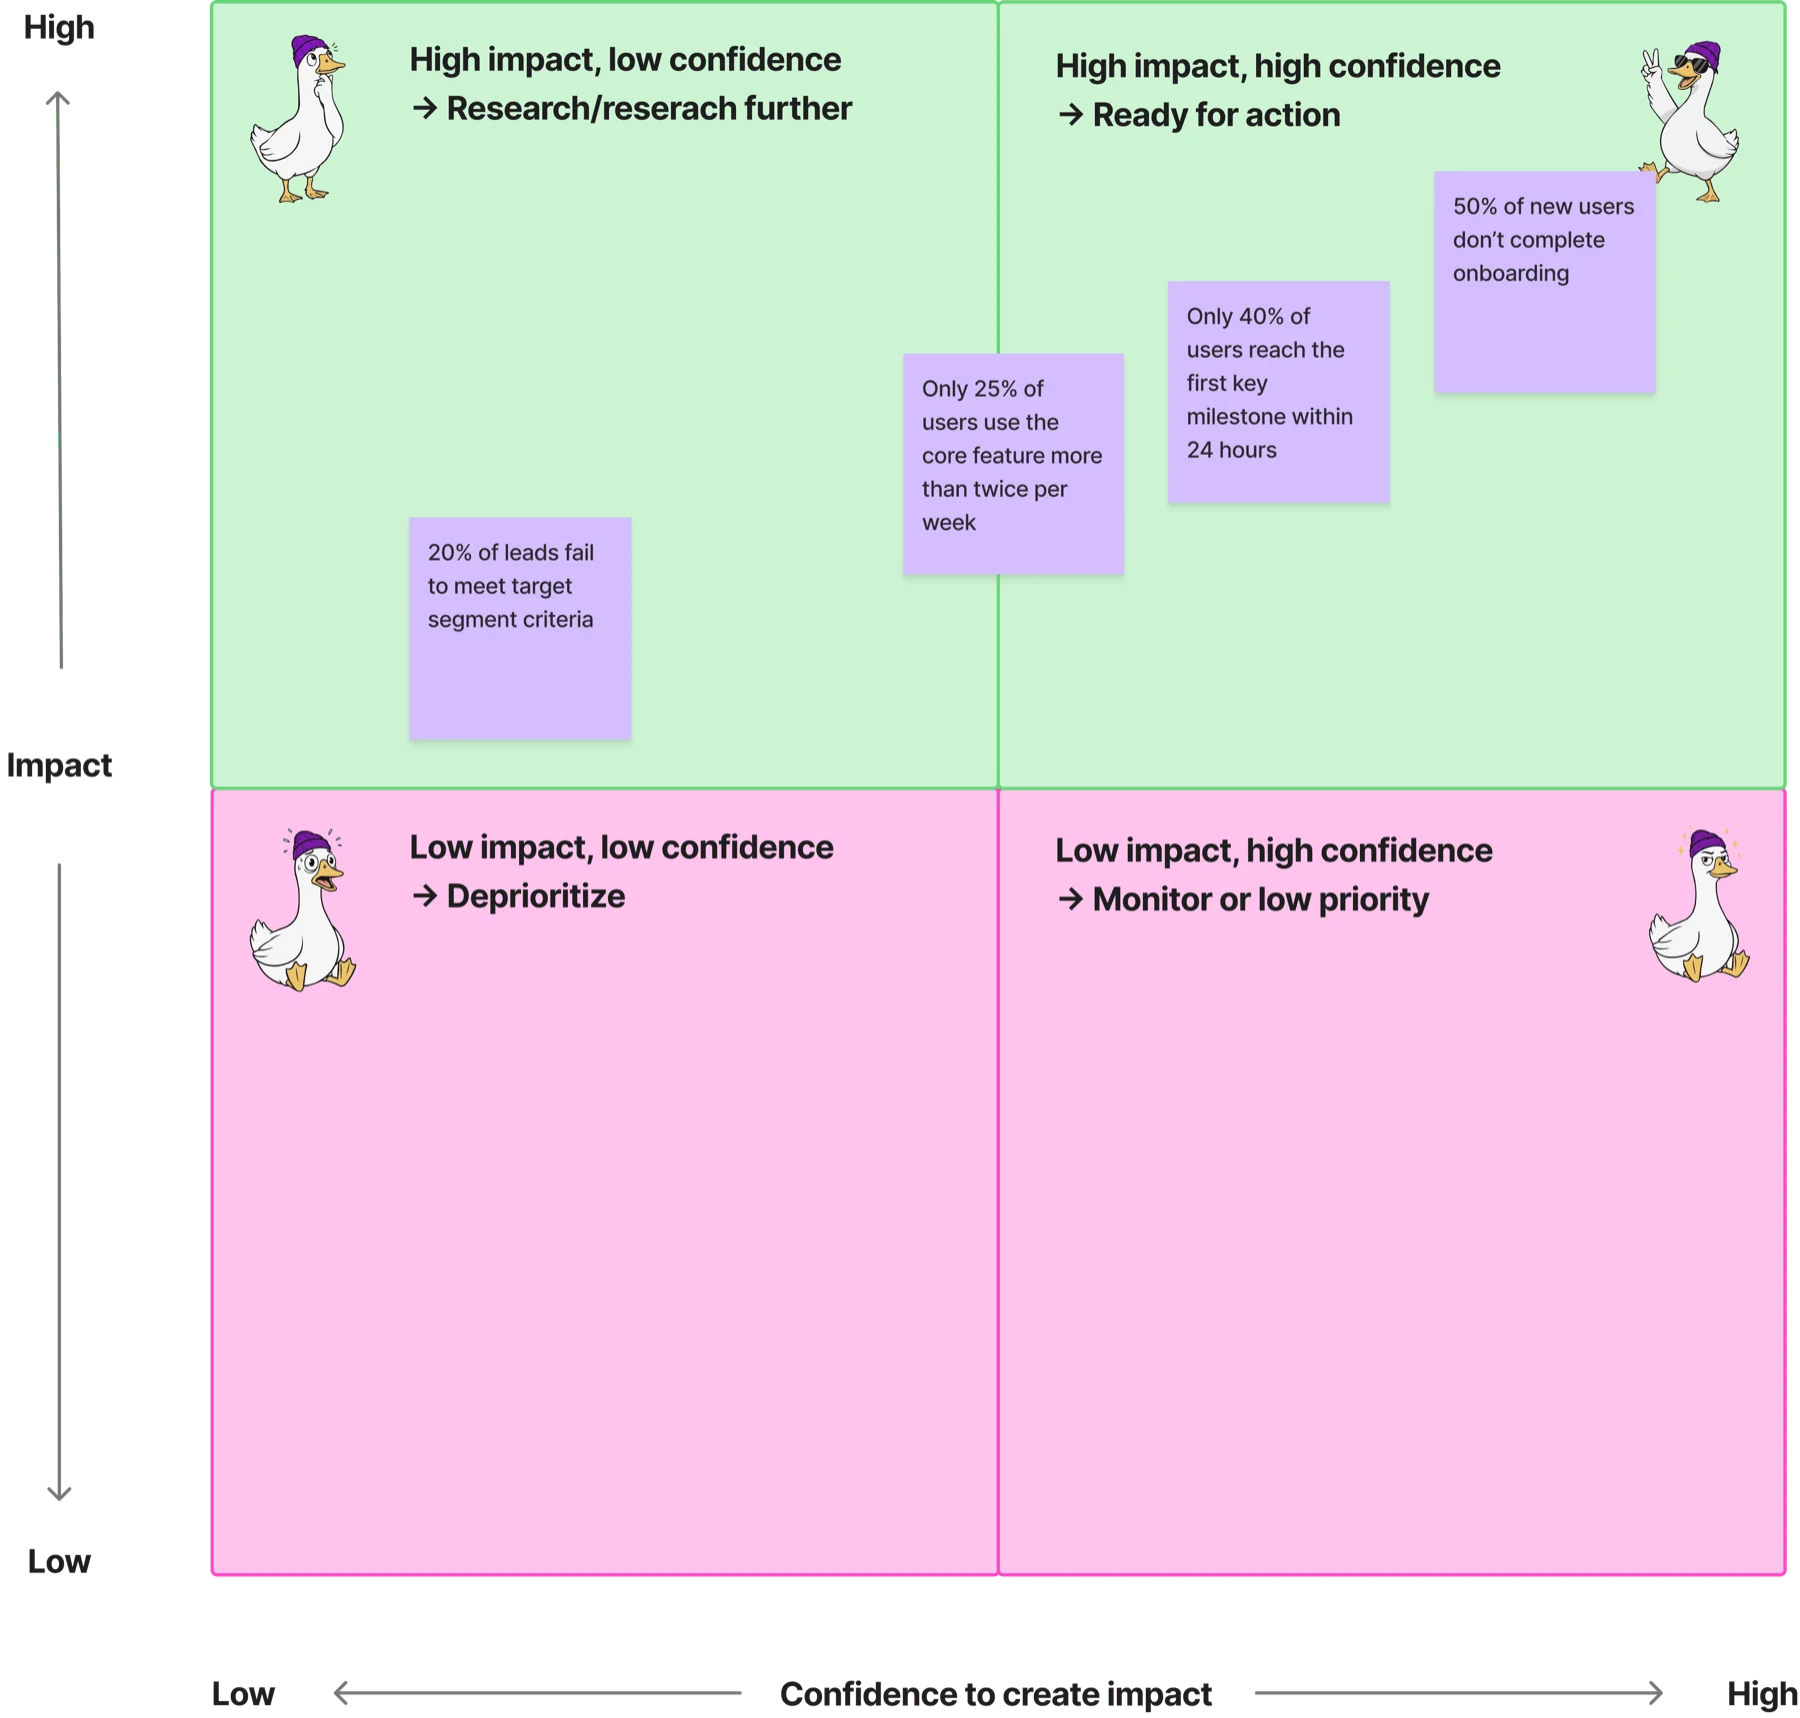
Once your team has identified the top 3–5 high-leverage bottlenecks from the Dependency Map, you’ll use the Impact-Confidence Matrix to prioritize action. For each bottleneck, the team must collaboratively decide where to place it on the chart: Impact (the vertical axis) reflects the estimated business and customer value gained if the problem is successfully solved; Confidence (the horizontal axis) reflects how certain we are that the outcome will positively contribute to our strategic hypothesis. The goal is to funnel resources toward the “High impact, high confidence” quadrant, the initiatives that are Ready for Action, while reserving the “High impact, low confidence” items for immediate research and deprioritizing the low-impact work.
Final step: Defining product outcomes
Your Dependency Mapping and Impact-Confidence Matrix have successfully identified three “Ready for Action” bottlenecks (High Impact, High Confidence). The next critical step is to define the specific results you aim to achieve by solving each of them.
For all three of your prioritized bottlenecks, you must define the target results using the SMART criteria (Specific, Measurable, Achievable, Relevant, Time-bound).
- Focus: The Outcome must directly measure the improvement in business or customer value that results from removing the obstacle.
- Example: If your obstacle is “50% of new users don’t complete onboarding,” a SMART Outcome might be: “Increase the onboarding completion rate from 50% to 75% within the next six weeks.”
For each defined Outcome, the team must clearly document the indicators that will be used to track progress and ultimate success.
- Leading indicators track immediate behavioral changes that anticipate the final result (e.g., initial click rates or feature usage).
- Lagging indicators measure the final business impact and ultimate success (e.g., the ultimate conversion rate or increase in revenue).
This ensures your entire team is aligned on the precise value you are targeting for each “Ready for Action” initiative before any solution is designed.
Examples
- 50% of new users don’t complete onboarding → Increase the new user onboarding completion rate from 50% to 75% within the next six weeks.
- Only 40% of users reach the first key milestone within 24 hours → Increase the percentage of new users reaching the first key milestone within the first 24 hours from 40% to 65% by the end of the next month.
- Only 25% of users use the core feature more than twice per week → Increase the percentage of active users utilizing the core feature more than twice per week from 25% to 50% by the end of Q3.
Iterate
Once the team has successfully solved the prioritized bottleneck and achieved the defined Product Outcome, it’s time to initiate a new cycle of improvement. The goal is to consistently find the next biggest leverage point and repeat the process.
- Identify the next bottleneck: Once one obstacle is removed and the “wheel” runs smoothly, return to your dependency map to find the next most impactful bottleneck to tackle.
- Repeat the cycle: The new iteration always starts by challenging the strategic hypothesis and proceeds cyclically: Strategic Hypothesis → RARRA Questions → Observations & Obstacles → Prioritization → Product Outcome → Iterate.
Every iteration is a chance to learn and build institutional knowledge.
- Maintain an insight log: Create a comprehensive insight log or learning repository for every obstacle and outcome you work on.
- Document everything: Record all lessons learned, the reasons behind decisions and failed hypotheses, and project successes.
- Benefit: This documentation ensures the team avoids repeating mistakes and that past successes can be leveraged when addressing future obstacles.
Continuous iteration and systematic learning are key to validating and achieving your strategic hypothesis.